See your meter data graphically

The volume of data available from modern Advanced Metering Infrastructure (AMI) has increased by several order of magnitude. Meters previously read quarterly, can now be equipped to supply readings every 15 minutes, but this is only useful if the tools are available to analyze and visualize the extra information.
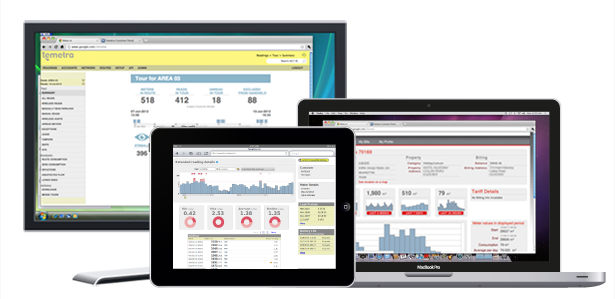
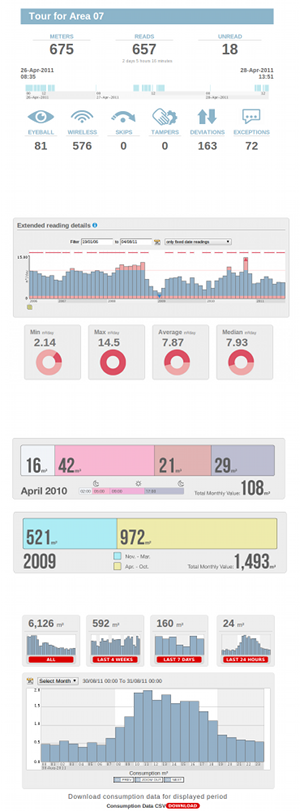
Temetra has visualization tools at the network level to help you get a dashboard view of your metering, and graphical views of individual meters for you and your customers.


